Empowering Businesses Through Innovative Data Solutions
Transforming data into actionable insights for sustainable growth
Empower Your Business with Technology
From automation and AI to cloud computing and data analytics, we help businesses streamline operations, enhance decision-making, and accelerate growth.
Whether you need low-code development, robotic process automation, cloud solutions, or custom software, we have the expertise to bring your vision to life.
Let’s build the future of your business together.
Who We Are
At Data Analytics & Visualisation, we specialize in cutting-edge digital transformation solutions that help businesses scale efficiently.
With expertise in Microsoft Power Platform, RPA, AI & ML, D365 CRM & ERP, Azure, AWS, Databricks, and Data Strategy, we create tailored technology solutions to drive success across industries.
Our Expertise Includes:
Business Process Automation
Reduce manual work with intelligent workflows.
AI & Machine Learning Solutions
Predict outcomes, automate processes, and optimize insights.
Cloud Strategy & Migration
Migrate, manage, and scale your business in the cloud.
Data-Driven Business Insights
Turn raw data into powerful analytics for smarter decision-making.
Let’s innovate together!
Our Services
We offer a comprehensive suite of technology services designed to help businesses stay ahead in a digital-first world.

Power Platform
Automate workflows, build apps, and gain insights with Power Automate, Power BI, and Power Apps.

Microsoft Fabric
Microsoft Fabric is an end-to-end AI-powered data analytics platform.

Robotic Process Automation (RPA)
Enhance efficiency with automated processes that reduce manual workload.

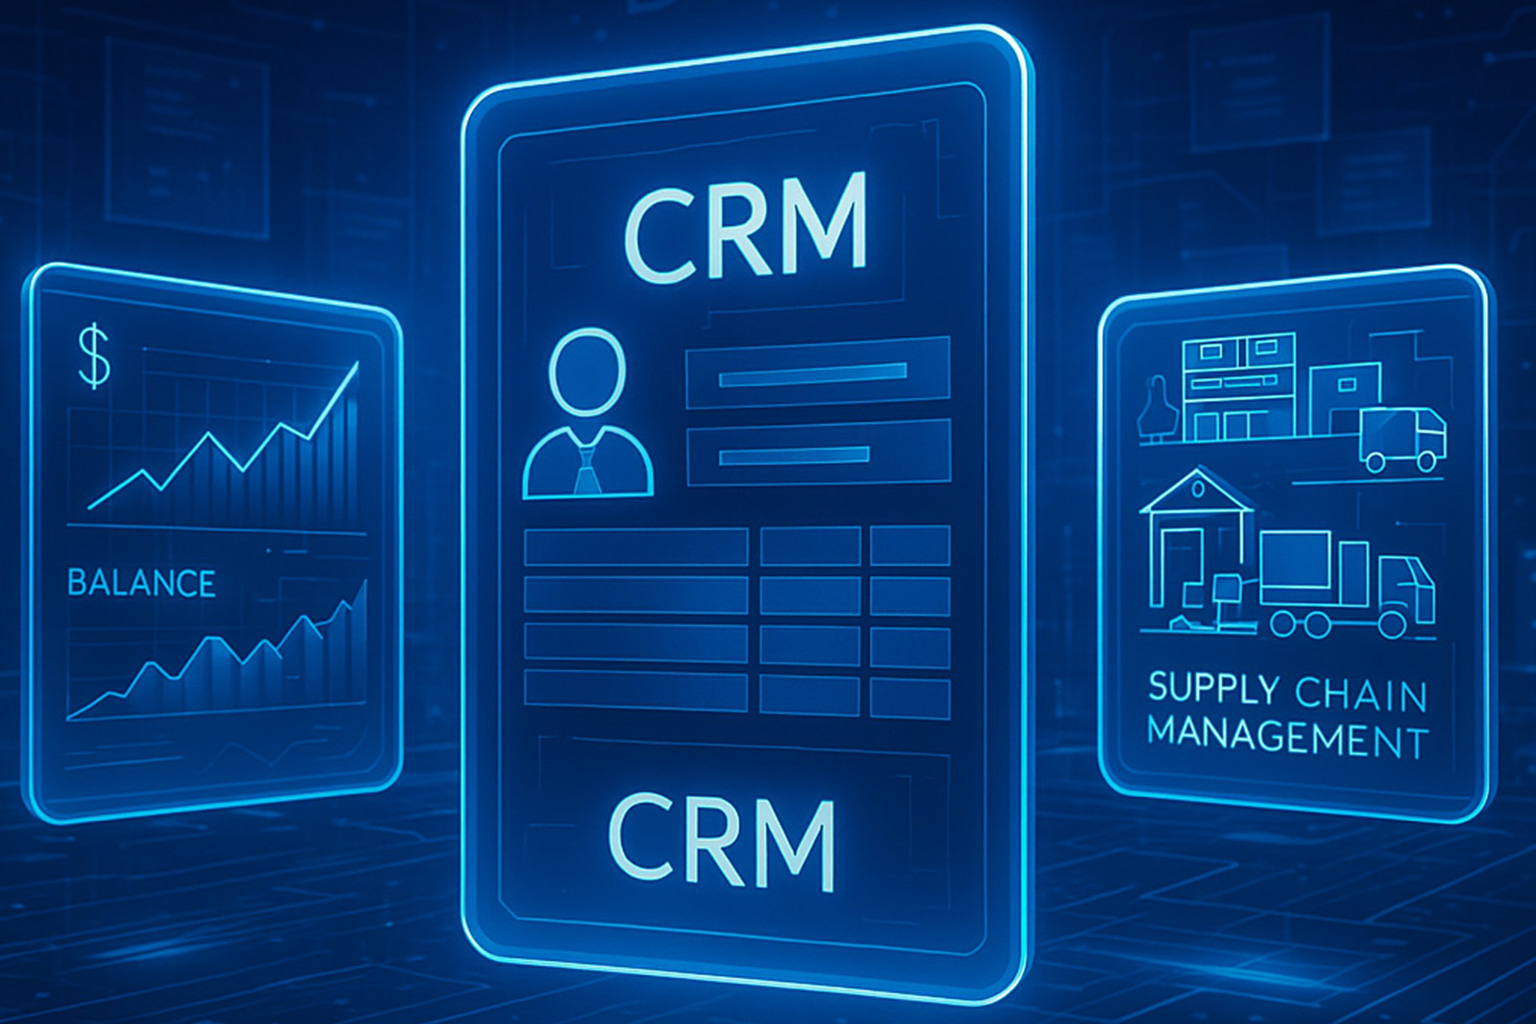
D365 CRM & ERP
Optimize your customer relationships, financial management, and supply chain operations with Microsoft Dynamics 365.

AI & ML Solutions
Leverage AI for predictive analytics, customer personalization, fraud detection, and automation.

Bespoke Application Development
Develop custom software solutions tailored to your unique business needs.

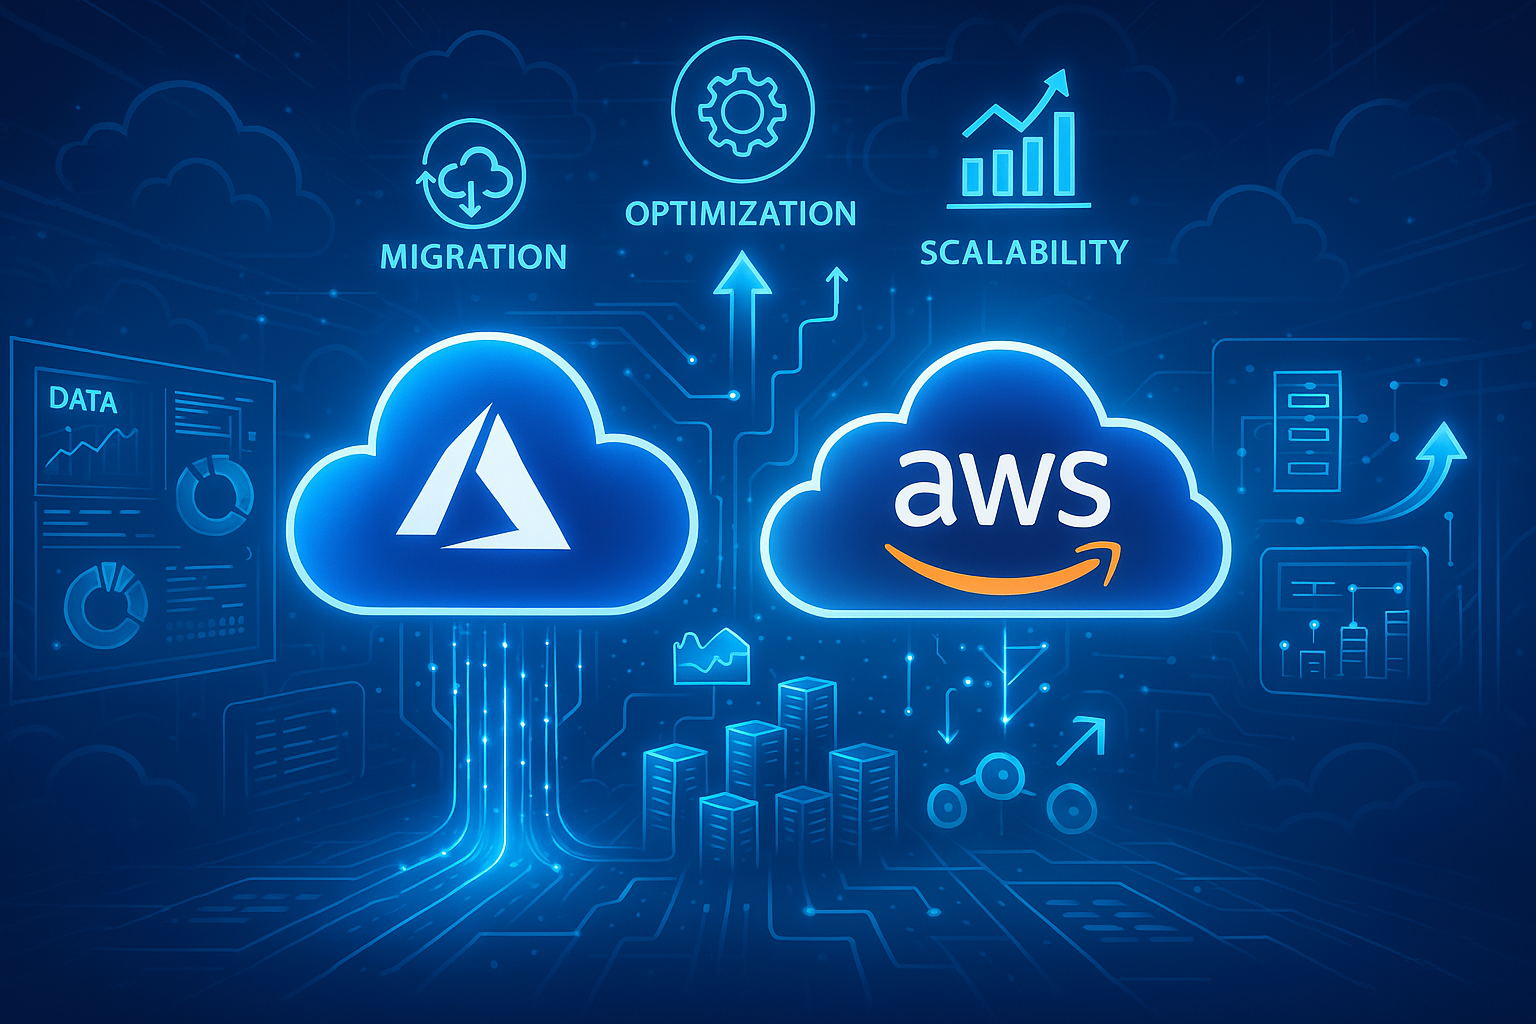
Azure & AWS Cloud Solutions
Migrate, optimize, and scale your business with Microsoft Azure & Amazon Web Services (AWS).

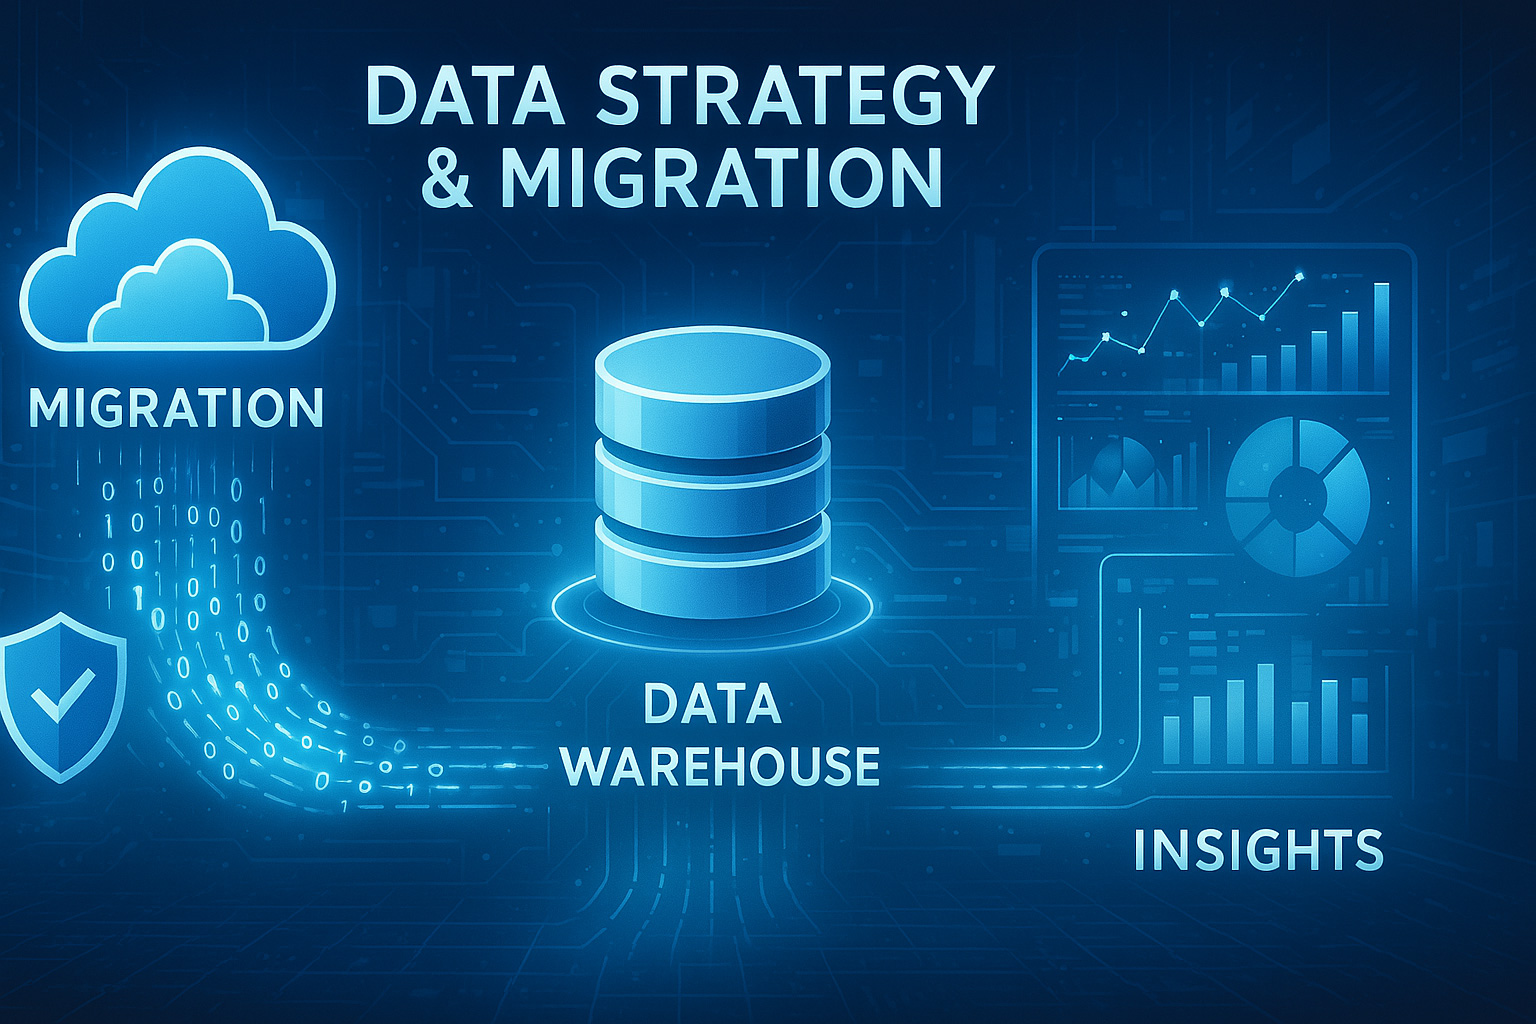
Data Strategy & Migration
Transform raw data into actionable insights with secure and seamless data migration.
Start your transformation today
Reach out for free expert, impartial advice.
Industries We Serve
We deliver tailored technology solutions across multiple industries, helping businesses solve unique challenges.
Banking & Financial Services
AI-driven fraud detection, automated KYC, real-time risk analysis.

Insurance & Risk Management
Automated claims processing, predictive risk modeling, chatbot-driven support.

Education & E-Learning
Student performance analytics, digital learning solutions, AI-powered tutoring.

Pharmaceutical & Healthcare
Regulatory compliance tracking, AI-driven diagnostics, drug discovery acceleration.

E-commerce & Retail
Personalized recommendations, demand forecasting, chatbot-powered shopping assistants.

Logistics & Supply Chain
Smart inventory management, real-time shipment tracking, warehouse automation.

Public Sector & Government
Citizen engagement portals, smart city solutions, AI-powered decision-making.
Global Network
Why Choose Us?
End-to-End Digital Transformation
From strategy to implementation, we deliver innovative solutions.
Industry Expertise
Proven track record across banking, retail, healthcare, and public sector.
Custom Solutions
Tailored applications that align with your business goals.
Scalable & Secure
Future-proof solutions built with security and compliance in mind.
Blog
Databricks vs Azure Synapse
Introduction Both Databricks and Azure Synapse Analytics are powerful data platforms for processing big data, analytics, and AI. However, they serve different purposes depending on business needs. Databricks for AI and Big Data Processing Databricks is built on Apache...
CoPilot in Power Platform
Introduction Microsoft CoPilot in Power Platform introduces AI-driven assistance in Power Apps, Power Automate, Power BI, and Dynamics 365. By leveraging generative AI, businesses can accelerate development, enhance automation, and gain deeper data insights. How...
Financial Reporting and AI
Introduction Traditional financial reporting methods rely on manual data entry, slow reconciliation processes, and static reports. AI-powered financial analytics revolutionizes this space by enabling real-time, automated insights, predictive forecasting, and anomaly...
Databricks vs Azure Synapse
Introduction Both Databricks and Azure Synapse Analytics are powerful data platforms for processing big data, analytics, and AI. However, they serve different purposes depending on business needs. Databricks for AI and Big Data Processing Databricks is built on Apache...
CoPilot in Power Platform
Introduction Microsoft CoPilot in Power Platform introduces AI-driven assistance in Power Apps, Power Automate, Power BI, and Dynamics 365. By leveraging generative AI, businesses can accelerate development, enhance automation, and gain deeper data insights. How...
Need Help?
Let’s Talk!
UK Address
Cardinal Point, Park Road, Rickmansworth, WD3 1RE
Dubai Address
Office – G-02-137, AL KHABEESI BUILDING, PLOT 128-246, Dubai, United Arab Emirates
India Address
15A, 4th Floor, City Vista, Tower A, Fountain Road, Kharadi, Pune 411014
Call Us
UK: 0208 138 8917
Dubia: +971 5855 13286
Email Us
info@dataanalyticsandvisualisation.com


